Hi Team!
The new Production Insights graphing features are very helpful!
I was trying to set up some burndown charts using the instructions on this page:
https://help.autodesk.com/view/SGSUB/ENU/?guid=SG_Administrator_ar_production_insights_ar_time_series_html
However, I am not able to get a goal line. The article above says:
You can only choose the “Goal Line” option in “Burndown” mode when you have the start and end date in your timeline range. This line is drawn using the total amount from the start date of your range to a target of “0” on the end date.
Could someone please explain in a little more detail about how to get a goal line?
Further down the article, it says:
To graph on a Phase, go to the Phase page. Then click on one of the phases, and view it on the detail page mode. You’ll see the option of the Phase timeline range. This burndown graph can be done on the context of any entity (release, shot, sequence, custom entity, etc.). It works best for entities you need to track with start and end dates.
Does this mean that we can’t get a goal line on a Global canvas page?
Regards,
Govind
2 Likes
Hi @Govind_Kalburgi,
Welcome to our Forum Friday event! And thanks for posting it so others could consume.
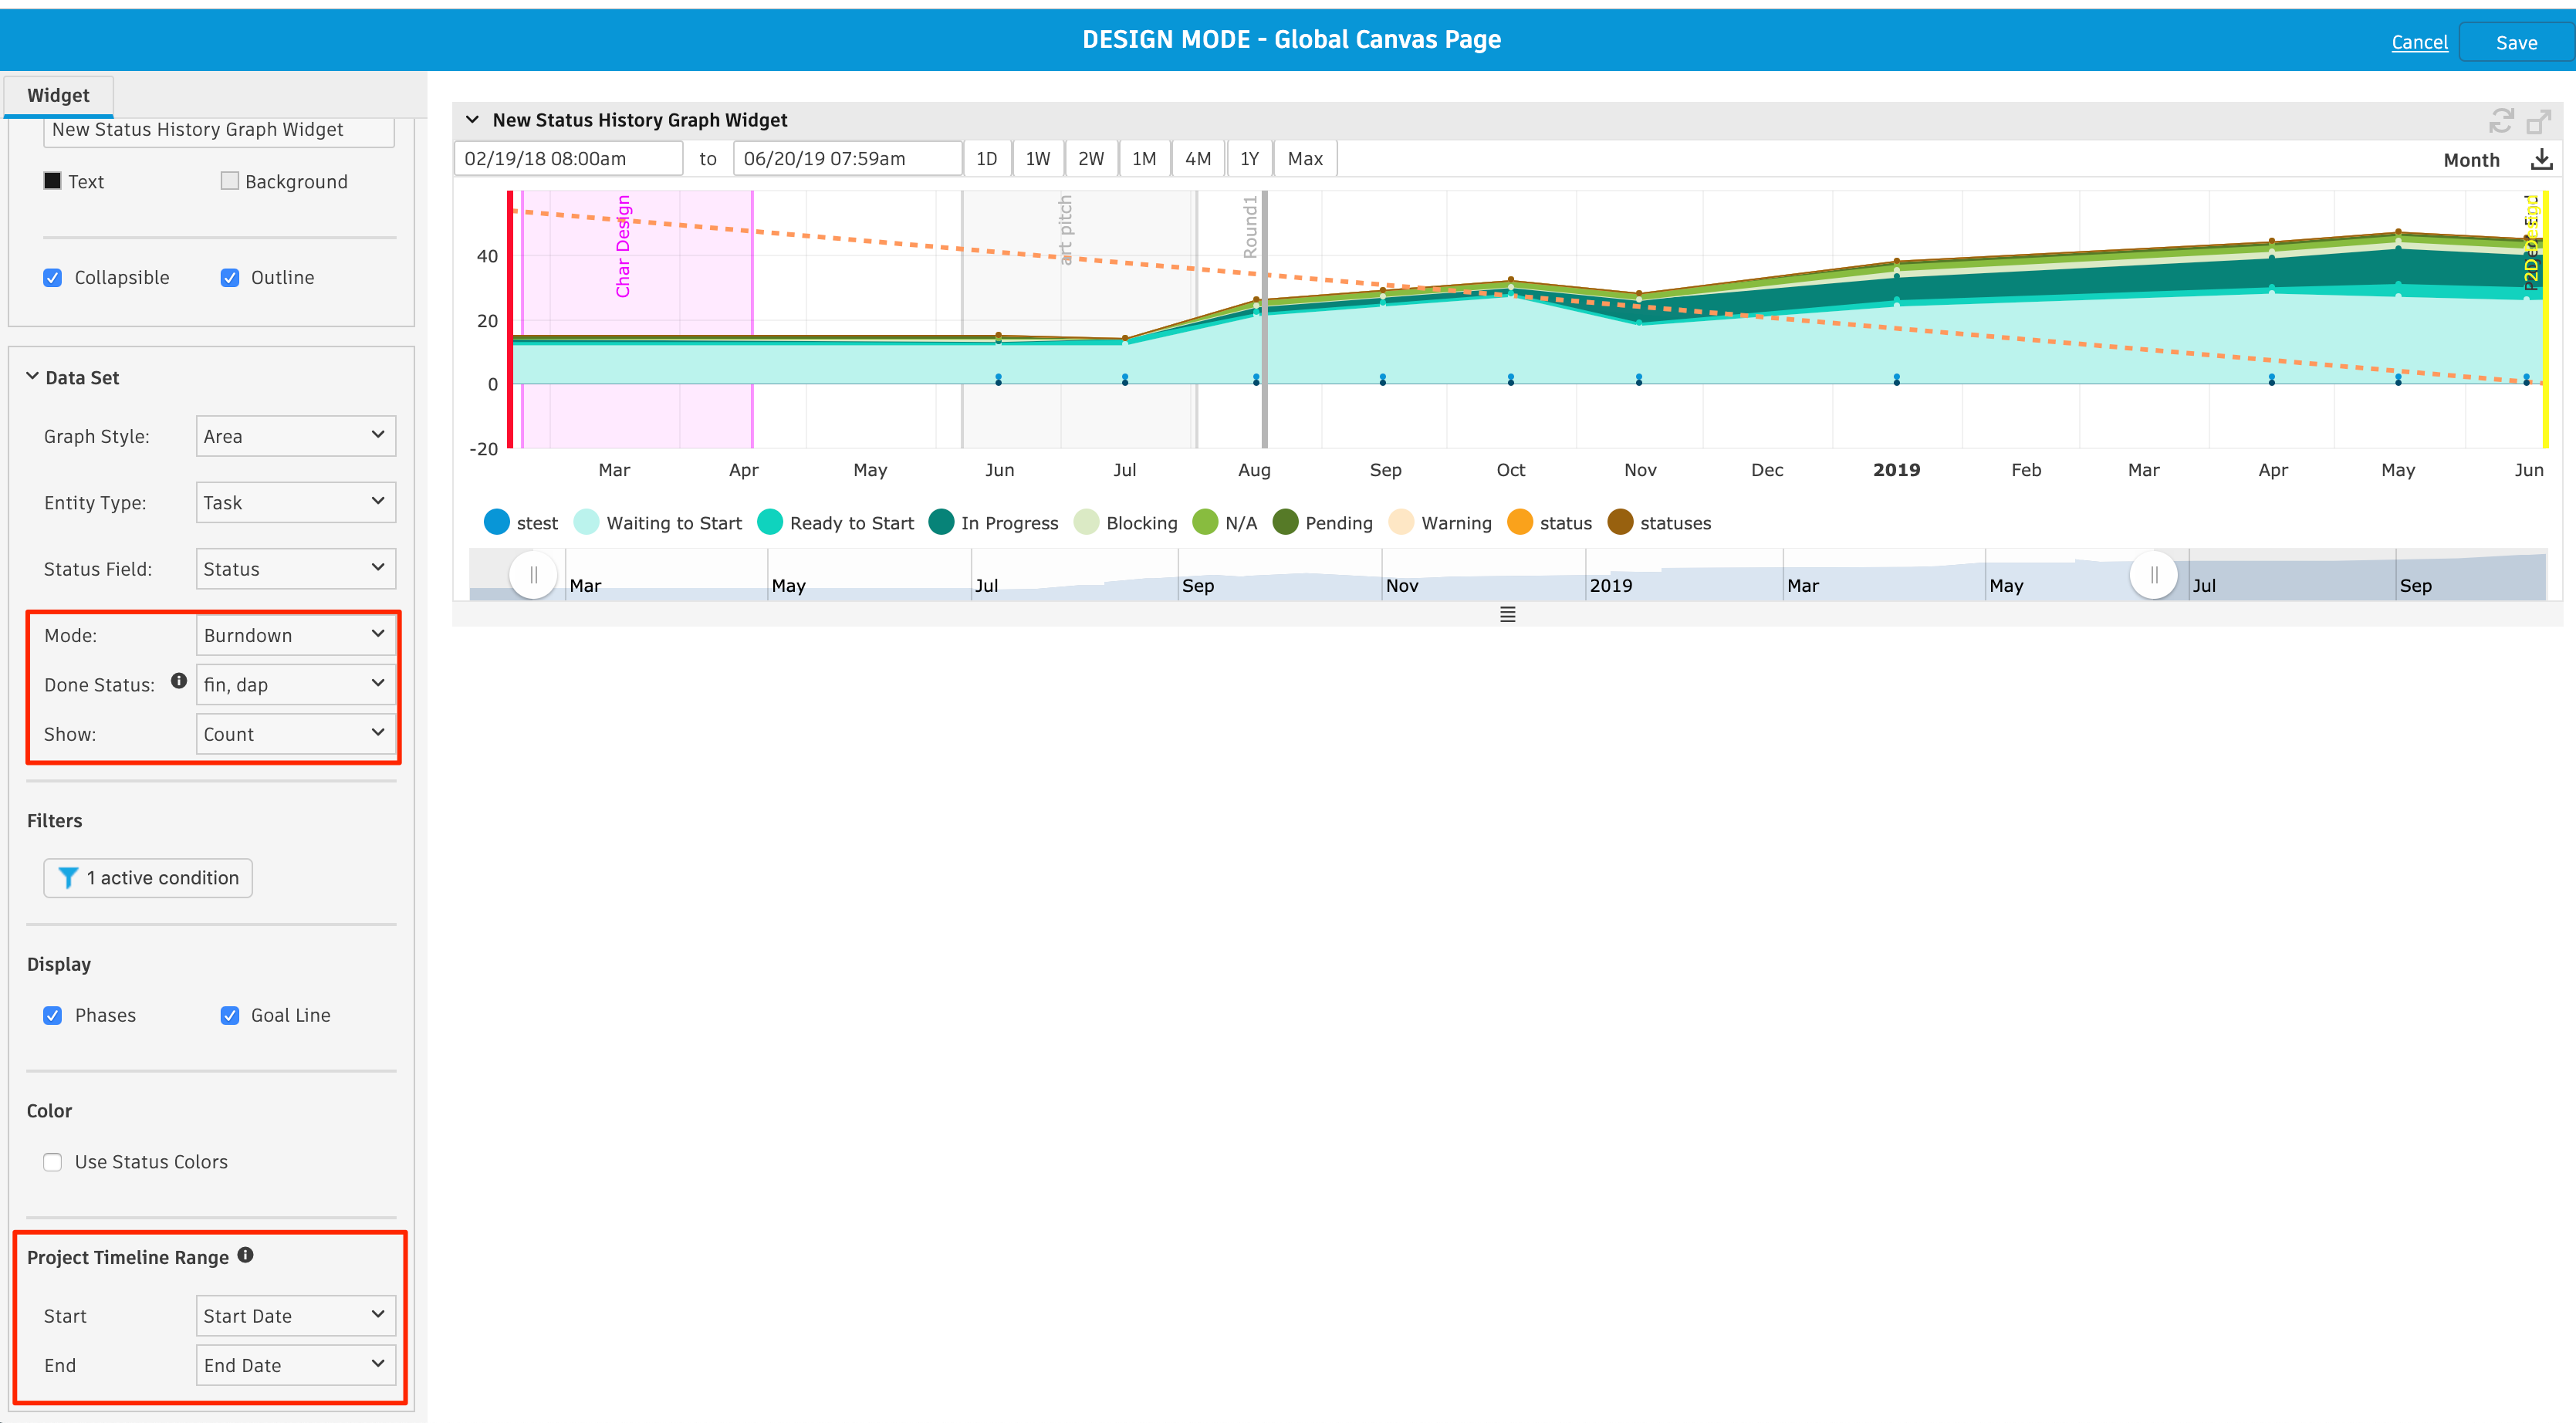
To set a Goal line, you need to go to Configure page of the “Status History Graph”, and set it as below:
- “Burndown” for “Mode”
- “Final” for “Done Status” (to exclude the “fin” status from your graph)
- “Count” for “Show”
And then to draw the dotted “Goal Line” to see your target goal, you need to set the Start and End of your Project Timeline Range. This line is drawn using the total amount from the start date of your range to a target of “0” on the end date.
I’m testing it on a Global canvas page, so don’t think it’s a problem at all. Let me know if you still don’t get the it.
Cheers,
Ben
2 Likes
Hi @Ben_xzj,
Thank you for the quick response.
I am clear about these steps.
The trouble I am having is with the goal line - the issue is probably because, I don’t see the Project Timeline Range settings. Here are the options I have:
Is this because I am on an older version of Shotgun?
I am on v8.4.2.4 (build 80f30c1)
Regards,
Govind.
Hi @Govind_Kalburgi. Currently, you would set the range for your burndown by assigning start and end date fields in the section below your screenshot (at the bottom of that panel). That said, we’ve long issues that are sub-optimal with range definition in our Burndown Chart implementation. You’ve probably noticed that changes to the date display fields above the chart itself are not retained when the chart settings are saved.
We are actually working on making it easier to define the range you would like to see on your graph, and have that setting stick as you save it. This work is in progress now, though I can’t tell you exactly when it will be fully QA’d and released. Stay tuned to our release notes, hopefully you should see this feature get much more useful in the very near future!
2 Likes
Hi @tommy.kiser,
Thank you for that context. Will stay tuned for those refinements!
However, I do not see any thing below my screenshot. What’s captured in the screenshot is the entirety of the options available to me.
1 Like
Ah, I think I see the issue - it looks like you are on a Global page. If you are creating your Burndown Chart on a Canvas page within a Project, then you would see an option to choose fields from the Project level to define the range of the timeline. As I said though, this is still not that useful, compared to being able to more explicitly set the start/end dates for your timeline.
3 Likes
Hi @tommy.kiser,
Thanks! I’ll try this from a project page.
But, would I be correct in assuming that we can’t get a goal line on a Global canvas page? Or is there a workaround to get it on a Global canvas page?
Regards,
Govind.
Hello @Govind_Kalburgi. I’m a bit late in the game but I though I’d share a potential workaround… not ideal I guess but until we get to improving our graph functionalities I hope it helps…
Basically, it’s about leveraging a global entity were you can store your goal line start/end dates and doing your canvas page in that global entity detail page which allows you to leverage the “context”/entity fields to set the global burndown goal line… I made a little video that explains it:
5 Likes
me again… while we’re at it, you could even add a Field Widget on the on the Global Date detail page so that you could edit the Goal Line fields (Start Date & End Date) in place:
1 - Add a Field Widget to the detail page canvas:
2 - Configuring it:
3 - End result:
7 Likes
Hi @bolducati,
You’re not late at all! Thank you for taking so much time to make a video recording.
My main intention behind creating Burnddown Charts in a Global Page is to have a single page with Burnddown Charts of multiple projects.
What I gather from the video is that I could add charts for multiple projects, but the goal line will be generated based on the same Start and End Date - and that defeats the purpose again…
Am I right in assuming that?
But, your video is very helpful and I’ll spend more time exploring what is possible! Thank you!
4 Likes
Hello again @Govind_Kalburgi. Thx for sharing your intention.
I guess we could do that but the workaround is really not ideal. I’d do it by replicating all the Projects start/end date into new fields for the Global Custom Entity, then, in the detail page you could select and fetch the dates from the fields you want.
1 - In the “Global Dashboard” Custom Entity grid add start/end fields for all Projects:
2 - In the detail page of the Global Burndown Canvas page, setup all the graphs and fields widget using the different project specific start/end
and then you can end up with something like this:
hacky and the down side is that you have to maintain the Projects start/end in the page manually but… still… in the meantime.
1 Like
Thanks, @bolducati!
It is a very hacky, indeed! 
Hopefully there are improvements to this in the next update!
3 Likes